When we analyze the Kansas City Royals and San Francisco Giants — the two teams currently dueling in the 2014 World Series — it’s not too difficult to figure out their most valuable players.
For Kansas City, Alex Gordon, Lorenzo Cain, Wade Davis and their entire bullpen come to mind; Buster Posey, Madison Bumgarner, Hunter Pence and Pablo Sandoval jump out for San Francisco.
But the way teams define value has changed drastically over the past 15 years.
Normal fans might put Alex Gordon and Buster Posey atop their pecking order based on home runs, batting average and other common statistics, and not too long ago baseball’s front office officials did the same. This all changed with the advent of Moneyball by noted financial writer Michael Lewis, and advanced sabermetrics, which is the study of baseball through a variety of statistics.
Homers are still important, and earned run average means something, but now more comprehensive statistics have been developed to determine a player’s value.
Wins above replacement (WAR), arguably the most ubiquitous sabermetric value, is a statistic that you should be familiar with if you want to understand how your team’s front office makes roster decisions. Here’s a great WAR explainer from Fangraphs:
WAR offers an estimate to answer the question, “If this player got injured and their team had to replace them with a freely available minor leaguer or a player from their bench, how much value would the team be losing?” This value is expressed in a wins format, so we could say that Player X is worth +6.3 wins to their team while Player Y is only worth +3.5 wins, which means it is highly likely that Player X has been more valuable than Player Y.
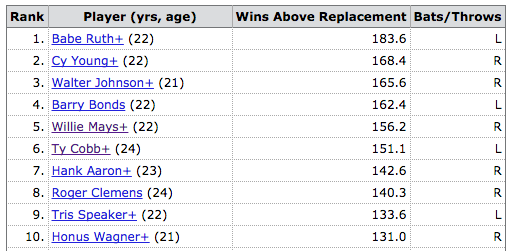
To get an idea of how this statistic translates into actual baseball, here’s the all-time career WAR list from Baseball Reference:

In 2014, Clayton Kershaw led MLB with 8.0 WAR, followed by Mike Trout (7.9), Josh Donaldson (7.4) and Corey Kluber (7.4).
The current leader on the big league active player list is Alex Rodriguez with 116 (although who knows if he’ll be able to add to that any time soon).
So, what does this all have to do with money?
Well, WAR can be a great tool for baseball’s GMs in determining how much cash they should dish out to a player. Royals center fielder Lorenzo Cain holds the team’s second-highest value (5.0) at an extremely cheap price of $546,000. He’s arbitration-eligible after this season, so expect a much bigger pay day for him.
With all of this in mind, I thought it would be interesting to look and see who the Giants and the Royals are getting the most bang for their buck from. (Hint: It’s rarely their highest WAR valued players.)
Royals: Cain is undoubtedly their best hitting asset when you consider his low salary, even though Gordon tops their WAR chart at 6.6. On the mound, Danny Duffy (3.5) is their best deal with a $526,000 one-year contract.
Giants: In the city by the bay, Brandon Crawford (3.2) — who made $560,000 in 2014 — is the Giants’ most valuable player, though, Posey leads the pack with 5.2 WAR. Bumgarner (4.0), who pulled in $3.75 million this year, is easily San Francisco’s best deal in their pitching lineup; the slumping Tim Lincecum actually had a -0.7 WAR (yes, you can have a negative value!) and put a $17 million dent into the Giants’ budget.
STORY IDEAS
Here are some good resources if you cover this topic:
• Bang For Your Buck (Sports on Earth)
• sabr.org
I’ll leave you with this clip from Moneyball.
***
Zach Bergson is a contributing editor for the Reynolds Center, and an editorial producer for Sports on Earth. Follow him @zbergson.


