
I always admire alternative storytelling, from video to maps to interactive graphics or just clever ways that writers use prose. A a recent business story in the New York Times recently caught my eye and I think it’s just ripe for biz reporters nationwide to localize.
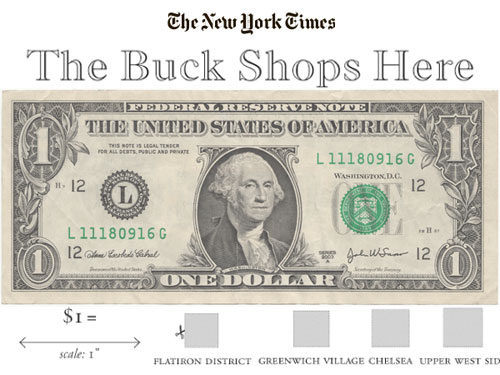
In “The buck shops here,”the NYT columnist Ben Schott came up with a really clever way to display relative housing prices by district or neighborhood. If you click, you’ll see a series of little grey boxes labeled with the name of various New York City neighborhoods, along with a few in other cities nationwide like Dallas and Philadelphia. What are those boxes? In actual size, they show the amount of residential floor space $1 will buy in all of those area.
The smallest box, less than one square inch, represents what four quarters will buy in New York’s Flatiron district; by contrast, about 64 of those tiny Flatiron squares will fit inside the space $1 bill buy in Memphis. (My eyeball estimates of the relative size of the boxes).
Quite interesting and while the city-to-city comparison in enlightening, I think readers/viewers in a local market would love a more drilled-down estimate. You could go street-by-street logging recent home sales — say, in the last six months or year — or block-by-block, by subdivision or by quadrant depending on the size of your market. The NYT graphic is based on actual sale prices as of January 2014 and credits Zillow for the data.
And indeed, Zillow does offer a great search engine of recently-sold homes; I did a ZIP code search and then quickly zoomed in on my neighborhood; price and square footage of houses and condos involved in recently transactions popped up quite handily. I would caution though — a recent sale right on my street reflected the accurate price — I was nosy and asked — but the listing represented on Zillow’s site referred to an older, smaller house that was on the premises before it was razed and replaced by a much larger dwelling. So if I used the published square footage as the basis of calculations, it would be off. You probably ought to double-check any recent transaction info with the real estate agent involved in the deal, or perhaps the title company.
Another good search engine is on Realtor.com, the site of the National Association of Realtors. It reflected sales that closed as recently as two weeks ago and of the ones I recognized, the photos seemed more recent and the specificiations up to date.
With both new and existing home sales on the economic release calendar for the week of April 21, the topic will be at front of mind for a lot of consumers, and showing them this novel way to compare what a buck buys in area real estate will make for a useful and educational feature. You can either drill down to the NYT’s “square inches per dollar” level or just illustrate the average price per square foot of living space for the examples you select.