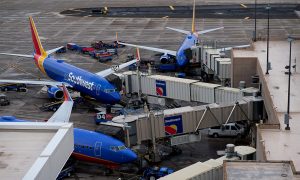
Ever had to change planes in Atlanta, and found yourself surrounded by fellow passengers? There’s a reason.
Atlanta’s Hartsfield-Jackson International remained the world’s busiest airport in 2014, handling 96 million passengers in 2014, according to the latest edition of the World Airport Traffic Report published by Airports Council International (ACI).
Traffic at Hartsfield rose 1.9 percent over 2013. China’s Beijing Capital International Airport ranked second in the ACI report, serving 86 million passengers in 2014.
The ACI report is a gold mine of story ideas. It offers data coverage for more than 2,200 airports in more than 160 countries worldwide, with information including airport traffic, rankings and trends on air transport demand.
Here’s a sample of the data.
- In 2014, worldwide airport passenger numbers rose 5.7 percent to more than 6.7 billion in the six global regions: Asia-Pacific, Europe, North America, Latin America-Caribbean, Middle East and Africa.
- The greatest number of passengers went through airports in the Asia-Pacific region, at 2.3 billion. Rounding out the top five were: Europe, 1.8 billion; North America,1.6 billion; Latin America-Caribbean, 531 million; and the Middle East, 308 million.
- The world’s top 30 airport cities handle more than one-third of global passenger traffic. London continued to be the world’s largest airport system with almost 147 million passengers handled at six airports in and around its metropolitan area. New York maintained the second position, with 116 million passengers at three airports, and Tokyo was third, with 109 million passengers.
In something of a surprise, airports in Europe and North America are catching up to the growth levels in emerging economies, such as Brazil, Russia, India, China and South Africa, said ACI Director General Angela Gittens.
Preliminary airport traffic results for the first half of 2015 show encouraging signs of steady growth in the global passenger and cargo markets. The overall passenger growth rate in the first six months of 2015 was up 5 percent.
For story ideas, look at the 2014 traffic numbers at your local airport to see if they were up or down. Look for more numbers in your airport’s annual report for 2014.


