Reporters across the nation covering mass transit initiatives in the upcoming ballot can turn to the National Transportation Database for vital insights.
According to the Center for Transportation Excellence, more than 30 counties have mass transit related proposals on the November 8 ballot. These measures ask voters for tax increases or renewals in exchange for improved services. Major urban areas included are Los Angeles, San Diego, San Francisco, Atlanta, Kansas City, Seattle and Charleston. The NTD program, run under the Federal Transportation Administration, supplies statistics and information on U.S. public transit. It produces a number of databases featuring reported information from all transportation agencies receiving federal funding.
Here are four ways to use this data in stories about current public transportation initiatives:
Rate the agency’s spending efficiency
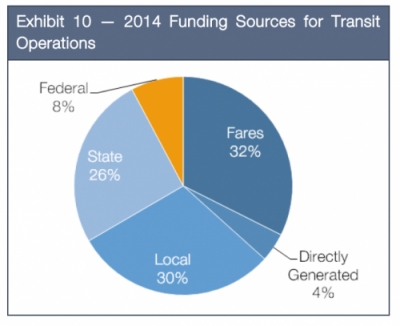
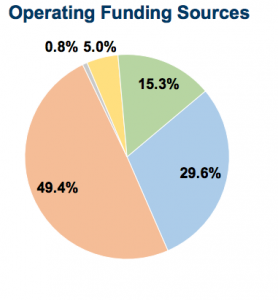
Look at how your local transit agency stacks up to the national standard. Every year the NTD puts out a NTST storyline covering major trends and revenue/ spending standards. This includes proportions of federal, local and state spending, cost per ride and cost per mile data for different modes of transportation and average fare recovery percentages. The fare recovery percentage tells how much of a system’s total operating budget is paid for by rider fares. The corresponding local data analysis is available in the NTD Transit Agency Profiles, which are searchable by operating agency, city or ID number.
King County Department of Transportation operating funding sources (right) compared to national averages (left)
Investigate the proposal’s potential payoff
Reporters can also use the Agency Profiles to compare data across different local transportation systems. Most cities have detailed information available about what public money would be spent on if approved. Compare this spending plan with the data on which local systems have proven the most cost effective in the past and which have the highest ridership to see if the investments are likely to pay off. The most current raw data on these issues is available on the Monthly Module Raw Data Release.
Question the plan’s sustainability
For a sustainability angle, look at the yearly Annual Database Energy Consumption. This database breaks down the energy type each transportation system uses and how much energy it consumes per year. Reporters can cross-reference with raw ridership data to show which systems are the most energy efficient and question investments in those that are performing poorly. Visit the U.S. Dept. of Energy’s Alternative Fuels Data Center for conversions between energy types and up-to-date information on fuel sources.
Look into how history might repeat itself
New transportation initiatives can prompt inquiry into how prior mass transit projects have performed. The Annual Database on Capital Use reports began in 2002 and detail capital spending for each transportation agency. Any sizable project from station updates to light rail expansions will show up here. Referencing back to the MMRD will allow you to view the number of monthly Passenger Trips (UPTs) over the same time period. Annual data on UPTs and passenger miles can be found here. From this information ridership gains or losses can be estimated for any time period in the last 14 years.
Reporter’s Takeaway:
• Information amassed by the National Transportation Database can help you give voters insight into how an upcoming transit bond would make use of their tax dollars
• You can dig into the data to find a variety of interesting story angles such as sustainability and historical review
• In a contentious issue like a potential tax increase, data can add credibility and balance to your story


