One of the biggest ongoing business stories right now is the steep rise in gas prices. Americans are feeling pain at the pump in unprecedented ways. Gas prices are up 48% nationwide over the past 12 months, according to the latest data from the Bureau of Labor Statistics’s (BLS) Consumer Price Index. That includes a month-over-month price spike of 18.3% in March due to sanctions on Russian oil and gas – including an outright ban on imports of those products into the United States – incurred by that country’s invasion of Ukraine at the end of February.
In order to combat these rising costs, which have increased steadily over the past 18 months, President Joe Biden announced on March 31 that his administration would release one million barrels per day from the U.S. Strategic Petroleum Reserve over the next six months. This is the third time his administration has tapped into oil reserves over the past six months. Still, gas commodities remain volatile – and high. We collected data from Bloomberg and BLS to help explain how we got here.
Crude oil futures plummeted during height of COVID-19…
By the time the World Health Organization declared COVID-19 a global pandemic on March 11, 2020, crude oil commodities were already experiencing a drop in price due to a lack of demand in already-locked-down China and elsewhere. When the majority of the United States entered a shelter-in-place order a few days later, prices dropped even more.
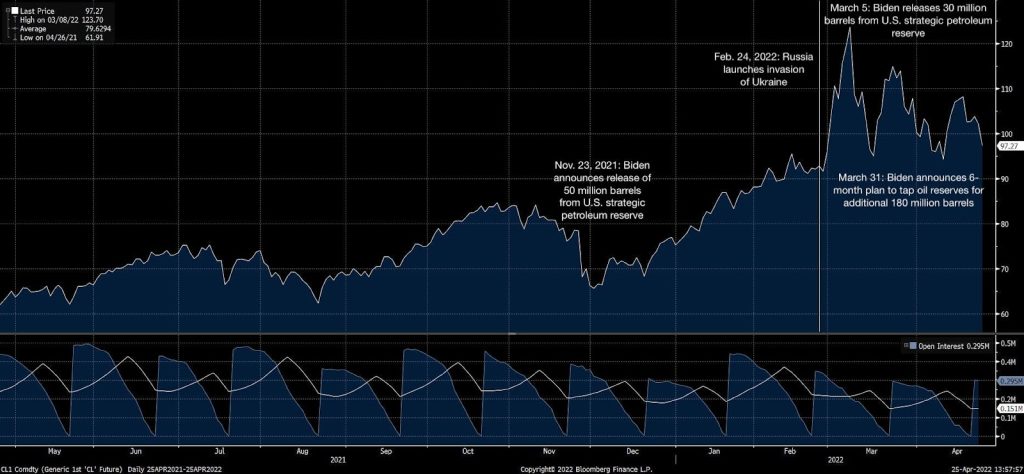
Even as domestic crude prices recovered throughout the latter half of the 2020 calendar year, they did not fully recoup their pre-pandemic price points until well into 2021, as vaccines against COVID-19 were widely distributed and more and more people became increasingly mobile. The dramatic dropoff and nearly-as-dramatic recovery can be seen in the chart here (via Bloomberg data through April 25, 2022):
… but spiked when Russia invaded Ukraine
The monetary strategy of the Biden administration’s legislation along with the doveish fiscal policy of the Federal Reserve under Chair Jerome Powell helped drive gas prices up further as the calendar turned to 2022, prompting Biden to announce the release of 50 million barrels of oil from the U.S. strategic reserve just before wintertime in November 2021. But the price increases that took place in Biden’s first year in office paled in comparison to the spike that took place when Russia invaded Ukraine on Feb. 24 of this year, prompting sanctions on Russian oil imports by both the U.S. and several parts of Europe.
The relative lack of oil supply caused prices of crude oil commodities to skyrocket, and they have remained volatile in the two months since. Announcements by Biden to release 30 million barrels of oil at the beginning of March and another 180 million over the span of six months at the end of March helped suppress prices, but only temporarily, as evidenced by zooming in on the above chart from a five-year view to a one-year view:

Gasoline prices appear to be normalizing, but not heating supply
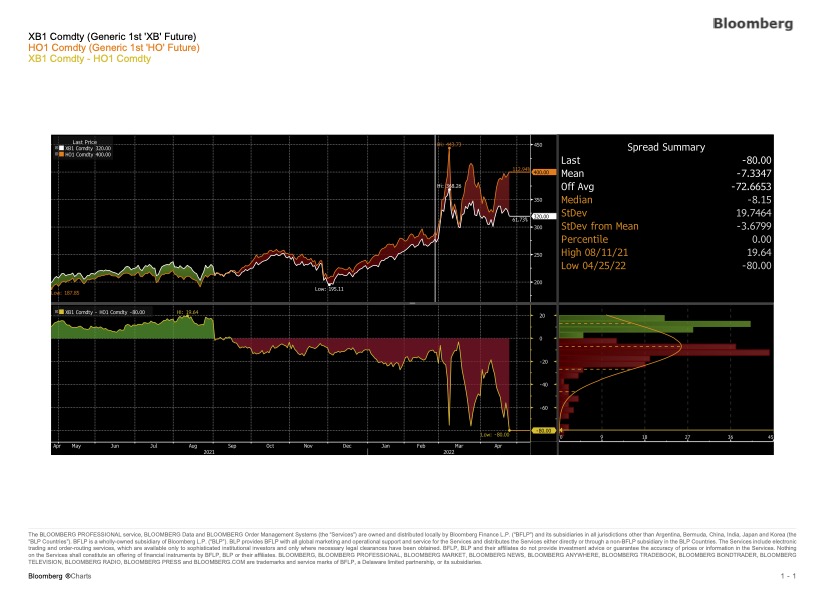
Understandably, given both refined products’ reliance on crude oil, gasoline and heating oil commodities are often extremely correlated. However, in the wake of the volatility caused by Russia’s actions and the sanctions that followed, gas and heating oil prices appear to be diverging as sharply as they have in years. Refined gasoline commodities appear to be normalizing somewhat while heating oil is still spiking:

Since we are entering the summer months, rising gas prices are a much bigger issue than heating costs right now. However, if the latter does not also stabilize within the next few months, it could be another headache for American consumers heading into the winter.
Using BLS data to find stories
While not all business journalists have access to Bloomberg Terminals, the BLS provides several extremely useful data tools that can help journalists understand these price trends and find new angles of coverage. One of the most useful is the Consumer Price Index, which we have a helpful guide for here. But there are also ways to dissect that data into specific categories, such as gasoline prices, as well as specific regions of the country.
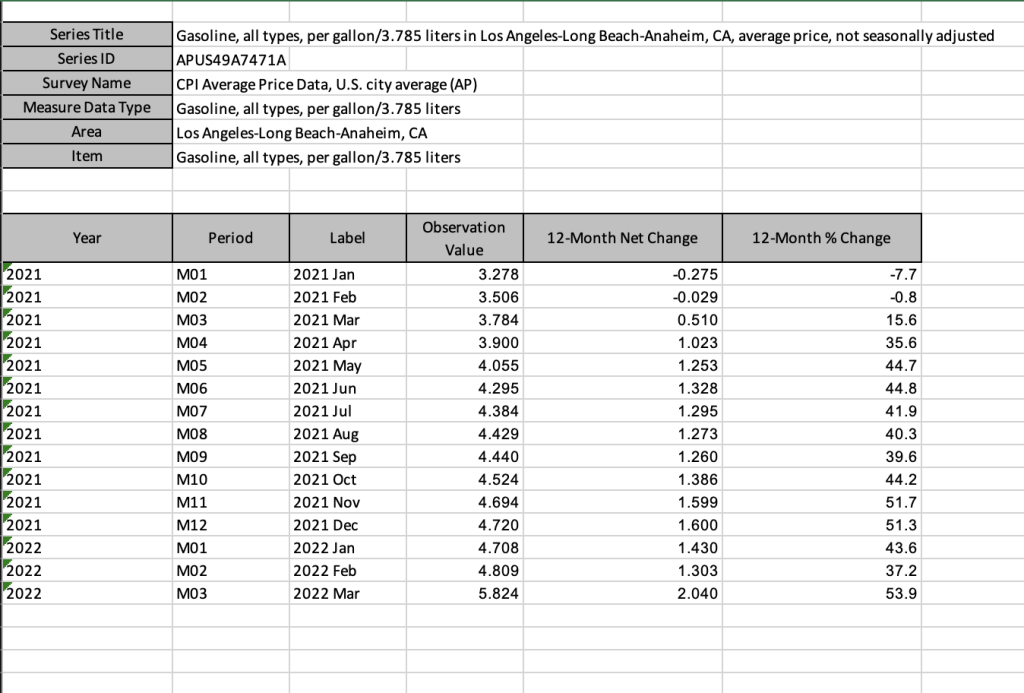
For example, a business journalist covering Los Angeles–a place infamous for its expansive, traffic-filled highways–can find specific data about gas prices in the Los Angeles metro area by going to the toolbar atop the BLS website, clicking “Data finder” and inputting “Los Angeles gasoline” in the search bar. Once results pop up, click the “Consumer Price Index” filter on the left side of the search results. The top four results will contain month-by-month price values for the three tiers of widely available unleaded gasoline–regular, midrange, and premium–and a four that averages the price of all three. The fourth, “all types” function will provide the most complete data.
Once you click on that, make sure to select the 12-month net change to see the year-over-year price increase for each month, or the 12-month percentage change to see the percentage year-over-year increase. Because the data is not seasonally adjusted, looking at the data year-over-year will provide the best perspective on how prices have risen. You have the option to download the data into an excel spreadsheet, where it will look something like this.

The BLS Data Finder is a phenomenal tool for business journalists, especially when looking for hard numbers to bring weight to impactful anecdotal stories like ongoing coverage of gas price issues. You can try out the tool for yourself here.


