What Is It? Why Analyze It?
Often managers announce current earnings results, discuss their business initiatives or talk about other interesting aspects of the entities they manage. While their comments are often informative, as a business journalist you will want to dig deeper. Many finance websites (e.g. Yahoo Finance) offer basic ratios such as return on assets, price to earnings, return on equity, etc. But the “days in operating cycle analysis” is seldom reported, is not difficult or time consuming to calculate and can signal early, interesting changes in business performance.
The number of days in an entity’s operating cycle is the sum of:
- The average number of days that an entity holds inventory. This is “days of inventory held.”
- The average number of days between selling inventory and collecting cash. This is “days of accounts receivable outstanding.”
For those familiar with this analysis, sometimes it is extended to a “cash conversion cycle” by:
- Summing 1) plus 2) then subtracting the average number of days that payables to suppliers are outstanding. (For brevity I’m not discussing the cash conversion cycle in this article. Please email me if you’d like a description and example.)
The result is a measure of operational efficiency. The idea is that a well-run organization will be able to efficiently manage its operations so that the number of days it takes to convert inventory into cash is low. Of course, interpreting results requires context (and will likely generate interesting questions to ask managers, analysts and institutional investors). Capital market participants who calculate days in an operating cycle typically start by comparing that to historical performance, competitors, goals announced by managers, etc. Let’s explore the attributes listed above using a few companies for illustration.
Days of Inventory Held
Many experts assert that entities managing their inventory well will sell it quickly. Walmart, for example, advertises itself as the “Everyday Low Cost” provider, and it attempts to manage its inventory efficiently to meet that objective. If Walmart purchases too much inventory, or can’t deliver it to its stores, or purchases items customers don’t want, its inventory will not sell. It is costly to invest in an asset (inventory) that nobody uses. On the other hand, if Walmart streamlines its inventory management system, the number of days it holds inventory should decrease, yielding a low-cost advantage over competitors. The “days of inventory held” offers clues about inventory operating efficiencies.
Although somewhat dated, Dell Computer Company in its hey-day clearly illustrated the days of inventory held metric. It held inventory for only six days. In comparison, other computer retailers held inventory for more than 30 days, some substantially more. Dell dramatically lowered its investment in inventory by adopting an online ordering model. Dell’s suppliers followed customer orders as they occurred and immediately shipped inventory parts. Dell assembled and shipped computers in about a week. At the time, the other large computer retailers sold via retail outlets such as Best Buy. Their inventory sat on shelves waiting for customers to buy it. As you may recall, computer equipment prices were dropping quickly so Dell effectively sold the most technically advanced computers at competitive prices while generating above market profits. Comparing Dell’s days of inventory held to competitors’ highlighted Dell’s competitive advantage.
Days of Accounts Receivable Outstanding
Numerous entities sell goods and services then collect cash at a later date. Most manufacturing firms operate this way, as do retailers that offer their own credit cards. Some retailers, such as Home Depot and Lowe’s have business-to-business accounts where commercial customers will buy goods and pay for them at a later date. Days of Accounts Receivable measures the efficiency with which entities collect cash from their customers and provides an early warning signal that customers are less able to pay, or less willing to pay. If an entity engages in aggressive sales tactics, often customers react by delaying payment. Likewise, customers may delay payment when product quality declines. If customers switch to competitor products as an end game, they may delay payments. If an entity’s billing systems don’t function correctly, companies may incorrectly invoice customers and delay payment. On the other hand, we can expect days in accounts receivable to improve when entities streamline their customer cash collection abilities.
An Example: Home Depot (HD)
Let’s calculate the number of days in operations for Home Depot (HD). First, recognize that HD will order and receive inventory. When it does, it records Merchandise Inventories on its balance sheet at the cost paid to buy the inventory:
When HD sells inventory, it records Cost of Sales on its income statement. Cost of Sales represents the cost of all inventory sold for HD’s fiscal year. HD discloses the following on its income statement:
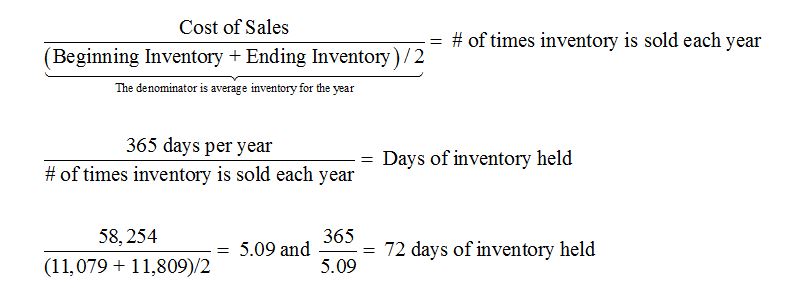
If HD is efficiently managing its inventory, it will sell lots of inventory (Cost of Sales will be high) while maintaining a small Merchandise Inventory (which will be low). Forming a ratio as:
HD sold its Merchandise Inventory about 5 times during fiscal year 2015 (HD refers to the year ended January 31, 2016 as its 2015 fiscal year), which is 72 days, on average.
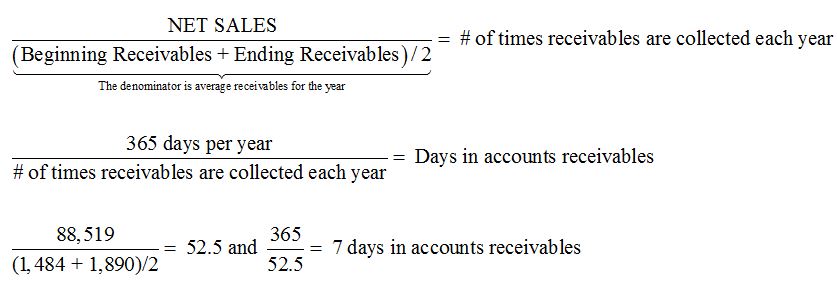
After HD sells inventory, it collects cash from customers. While most retail customers pay with cash or a credit card that delivers cash within a day to HD, HD does sell to commercial customers who pay at a later date. We can calculate days in accounts receivable as:
HD collected its receivables about 52.5 times during fiscal year 2015, or every seven days. Since most sales are paid for via cash or credit card, a small number of days is not surprising.
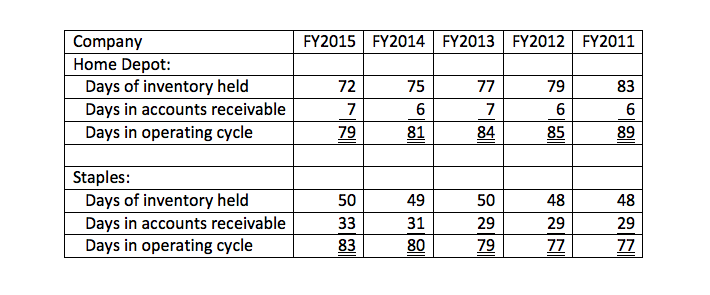
In total, HD took about 79 days to convert its overall inventory into cash. Comparative results follow:
These results look interesting. Home Depot’s days of inventory held have steadily improved over the last five years, and likely signal long-term better operating performance. Inventory is a large asset for HD and inventory management substantially influences its competitive position and profitability. HD’s days in accounts receivable doesn’t signal much. I also included Staples as a comparison. Note the deterioration in its days in accounts receivable. I searched briefly but did not find any discussion by Staples management about its customer cash collection efforts. Perhaps this absence provides an interesting article for you to write.


