As they say, time flies: Hard to believe that later this month it will be five years since the mortgage meltdown, Lehman Brothers’ bankruptcy filing and the start of Wall Street’s big slide, all of which triggered the recession that still has shrunk job prospects, retirement nest eggs, home-buying dreams and other expectations for a wide swath of Americans.
As an economy we haven’t really been living the “having fun” half of the time flies cliche, but you’ve got to admit that for business writers it’s been interesting times. You’ll want to mark the milestone somehow, no matter what your beat or together with colleagues to provide an analysis of how your region is faring on a variety of fronts, from real estate to jobs to poverty.
It’s a tall order and I’ll try to give each topical area its own blog post soon, but with the anniversaries looming, here are some resources and ideas to get you going:
Recap.
Analyses of the financial crisis that started with a slide in home sales in 2007 and peaked with the Lehman meltdown in late 2008 abound on the internet; conclusions vary depending ont he political leanings of the authors. In case you need a refresher, here’s a roundup of various theories from Slate.
And here’s the 663-page PDF of the federal Financial Crisis Inquiry Commission; if you don’t have time to page through the entire thing (its narrative is surprisingly readable, though) here’s an NPR synopsis of the competing reports-within-reports and the party-line split of the conclusions. Another report, more critical of Wall Street and regulators, was issued by a U.S. Senate investigations subcommittee and is known as the Levin-Coburn report.
So, how can you best serve your audience in acknowledging the five-year mark in what likely is the most dismal period of time most consumers (under age 70 or so) can recall living through? Personal finance is where I”d start.

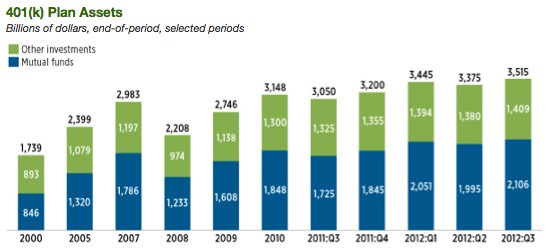
With most individual investors experiencing the stock market via 401(k) or similar plans (403(b), 457, etc.) you can review for readers how returns have waned and wax since late 2008; here’s a fascinating chart of the daily close of the Dow Jones Industrial average from 2000 to present; check out the chasm that formed starting just about five years ago, and the remarkable rebound since then.
I was somewhat surprised to read in this report from the Investment Company Institute (dated a year ago; it looks like they’re probably just about to issue the 2013 version) that only 3.7 percent of 401(k) participants in 2008 stopped making contributions to their plans. What I wonder is — how many people stopped or lowered contributions since then, due to job losses or other strapped circumstances. I would start with your area’s largest employers, plus a sampling of medium-sized and small companies across a variety of industries, and ask them to provide stats on 401(k) participation and contribution rates, as well as investment returns. You can also find out who administers some of your area’s most wide-reaching plans — firms like Fidelity and TIAA-CREF are likely prospects — and ask them if any figures for your market or state are available. And here are some other factoids about 401(k)s from the American Benefits Council, a group that represents employers and investment companies (hence the upbeat spin.)
Try to do some narratives or case studies; financial planners can connect you with clients who save via common plans, but that will likely still you only to a more affluent demographic; also try via unions or even civic/social groups to connect with workers at many socio-economic levels. If they can produce statements from the past five years (likely via online access if not hard copies) you can ask a pro to analyze them, and show the results of decisions made in response to economic factors — some who continued saving, some who stopped, some who dipped in for 401(k) loans, etc. — as a way of educating readers about the long-term ramifications of both choice and circumstance.
Here’s a Marktwatch article about the 401(k) gender gap, for example; you might try to localize that. Singles also lag, and 401(k) participation rates vary by education level, as well, according to this just-out “Retirement Inequality Chartbook” from the Economic Policy Institute. As well as taking a look at how the stock market slide, Great Recession and mortgage crisis have affected households to date, why not take a forward-looking view at how employers, financial institutions, state and federal regulators are (or are not) assisting citizens in planning for long-term financial security? Automatic 401(k) enrollment and other simple measures — are they being adopted by employers you cover? What about employer matches, how do they compare now to pre-recession? Are companies tightening loan procedures and rules?


