As the world grows more interconnected, so do food systems. Most communities import their food from many regions; local growers are additional sources. At the same time, those local farms choose what to produce and where to ship based on market pressures. The flow of food can have very real consequences on food prices and availability to communities. The following databases can be used as resources to begin or add to a current analysis of the food system of any state or major city.
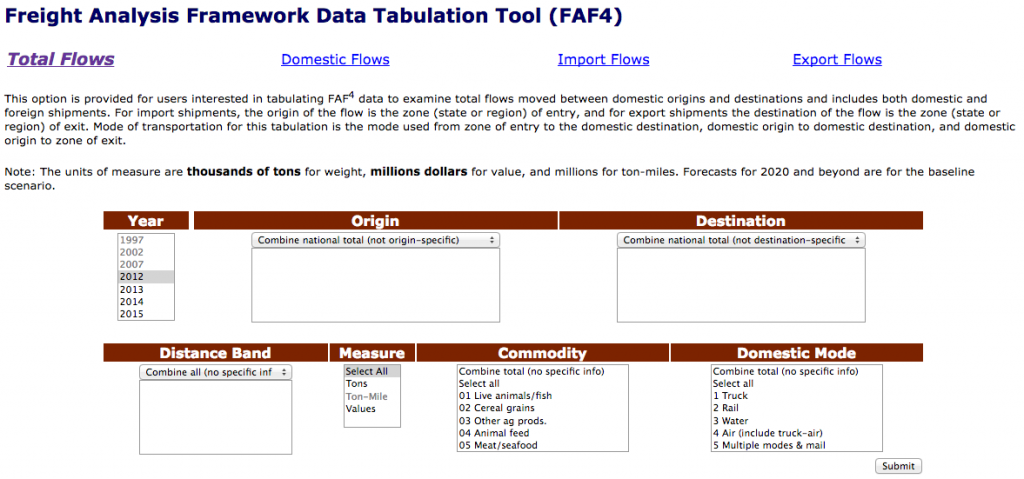
Freight Analysis Framework
This resource from the Center for Transportation Analysis helps journalists assess the flow of food through their area. The database provides information on all materials being shipped into and out of FAF Zones. Typically a zone will be made up of one mid-sized city, multiple small cities or large rural area. Some very large cities will have more than one FAF Zone. Materials shipped are organized by food category and transportation type. This database does have limitations, chiefly that it only provides shipping patterns, not final destinations or origins. For instance a journalist in Phoenix could find that a large percentage of the city’s food is shipped by truck from Los Angeles. However, there is no certainty whether this food actually originated in L.A. or if it was simply shipped there from other areas for processing and then repackaged.
• Use this database to see how food flows through your city and to get a good sense of overall patterns.
State Commodity Exports
This U.S.Department of Agriculture database is more specific by commodity. It breaks down exports by state and provides information dating back to 2000 on a wide range of food items. It also ranks the states by the value of each commodity they export, making it very easy to see where a state fits into the larger U.S. picture. The export numbers can be compared with total production to see how much local agriculture is consumed in the state. The U.S.D.A. provides up-to- date information on value and amount of crop production.
• Look at these two databases to see what food products your state is producing and how much of it is exported each year.
2012 Commodity Survey
Available on the Census Bureau’s American FactFinder, the 2012 Commodity Survey gives shipping information specific to every commodity imaginable, from dried vegetables to cereal grains to malt beer. Geographic data is broken down into regions inside each state, which can range in size and population. Data is provided for a region as both as a destination and origin point. It also provides useful details such as average miles per shipment and the percent change from 2007 to 2012.
• Study this survey to find details on what commodities are shipped into and out of very specific geographic areas.
USDA Food Environment Atlas
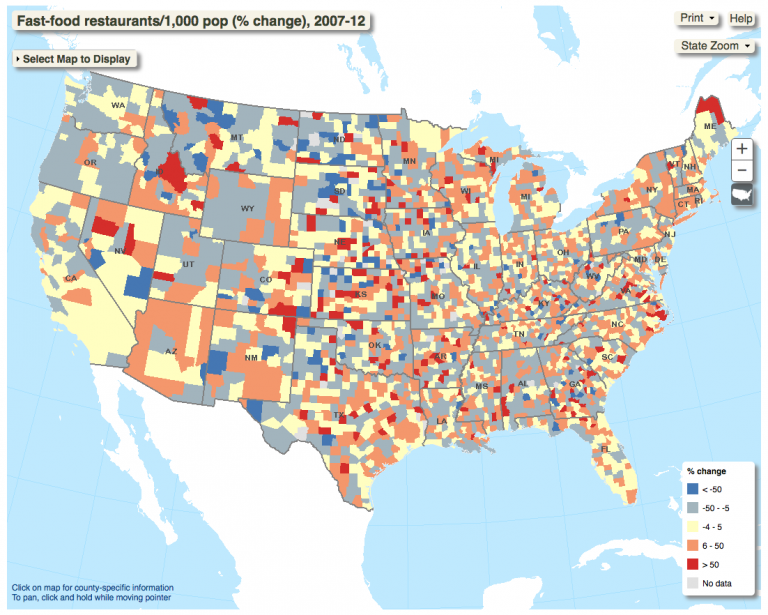
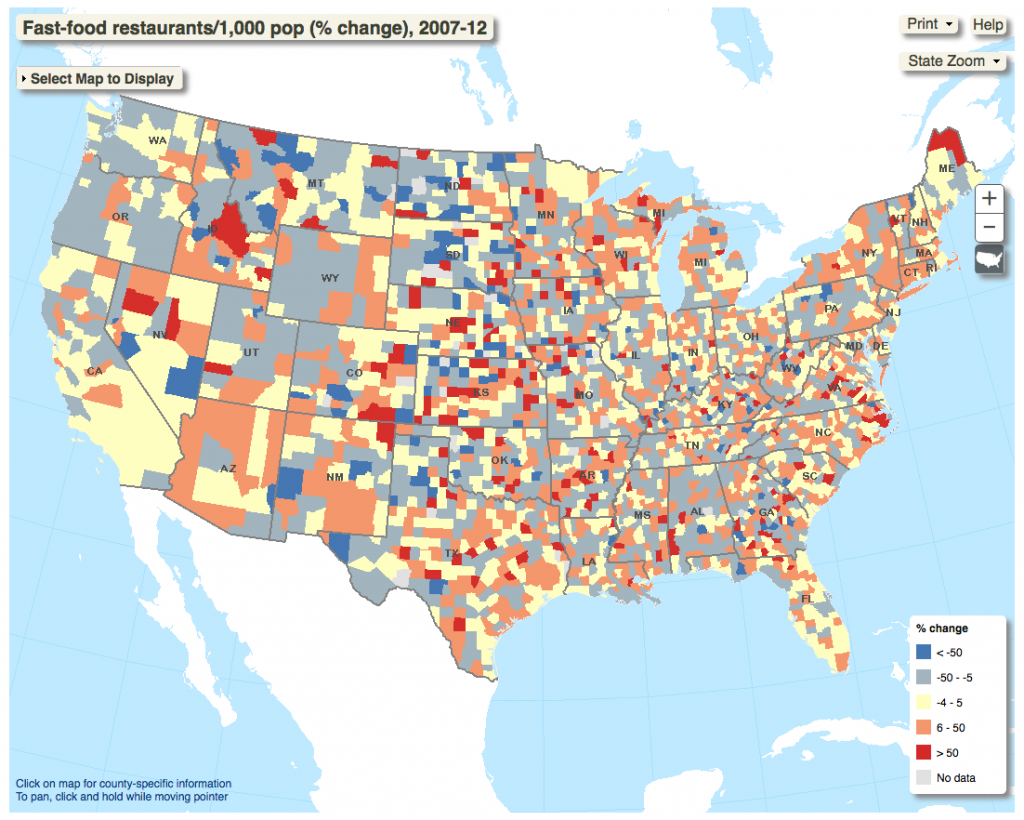
The Atlas is an interactive database that has compiled a variety of relevant food data for each county across the U.S. Topics include direct farm sales, supermarket availability, number of fast food restaurants and healthy food access. Historical changes are noted. The information varies in how often it is updated, but it provides easy-to-follow information on how different areas in the U.S compare on a large variety of food-related issues. Each dataset from the site’s maps is available by link.
• Peruse the the Food Environment Atlas for a wealth of information about food availability and access in each county in the U.S., including how regions compare with each other.


