The International Trade Administration provides reliable first-hand data for business journalists looking into trade affairs, which you can find at export.gov. One of the most important tools found on the site is its section of trade data and analysis examining exported goods. Here are three databases you can find through the site that may be helpful when formulating business stories on exports at the national, state and local levels.
National Trade Data
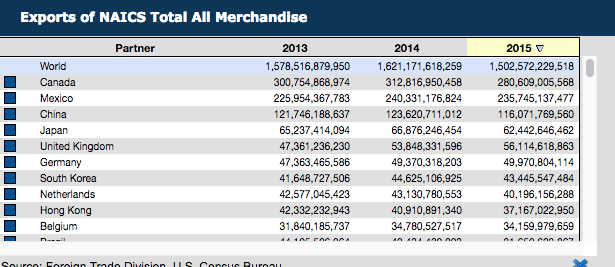
Here you can find international trade data for U.S. goods collected annually and quarterly. For example, the U.S. exported over $1.5 trillion of merchandise in 2015. That was a 7.3 percent decrease from 2014 but a growth of 84 percent since 2004.
This type of data is useful for a variety of stories. For example, the magazine Global Trade used export data in a discussion of how U.S. international trade might change under President-elect Trump. The magazine cited the fact that nearly 20 percent of all U.S. goods exported in 2015— $516 billion—went to NAFTA partners Canada and Mexico. This number could fluctuate depending on the promises Trump keeps during his time in office.
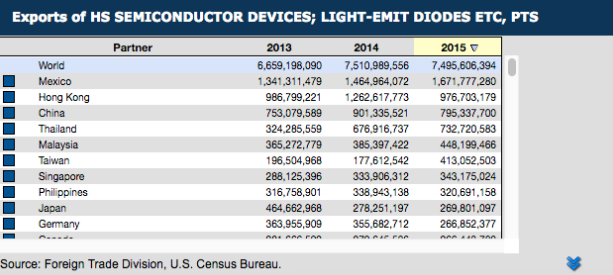
You can also filter the result by industry classification. For instance, in 2015, China remained the top market for the U.S. semiconductor industry. That helped make the semiconductor industry the third-largest source of U.S. manufactured exports, according to U.S Commerce.gov.
State Trade Data
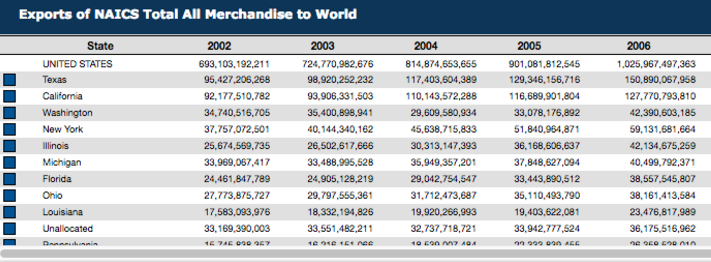
Tapping into this database you will discover reports and figures on goods exported from each U.S. state. One example: Since 2002, Texas has led the country in exports, accounting for nearly 17 percent of nationally exported goods in 2015.
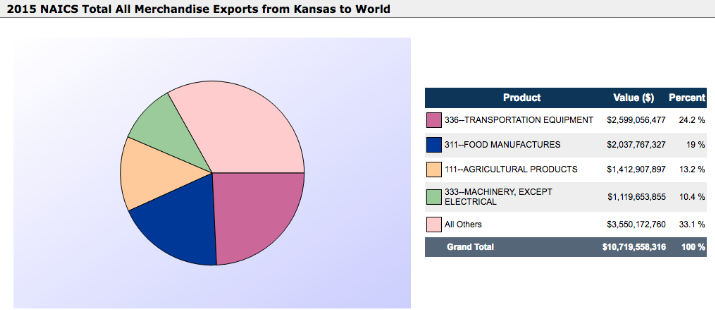
You can also use this database to trace a state’s exports to other countries. The Columbus Dispatch used export data to report that a third of central Ohio’s exports went to Canada. The export product profile can also help you analyze important figures like employment data. This database shows that transportation equipment accounts for a large amount of Kansas’s exports—24 percent of the state’s total export value—followed by food and agricultural products. It’s no surprise that over 280,000 Kansans are employed in the wholesale, retail, and truck or other transportation industries, according to U.S. Department of Commerce.
Metropolitan Trade Data
Finally, you can find good export info in your local area by tapping into individual U.S. metropolitan area databases. For example, despite an 18 percent loss in the value of exported goods in 2015, the Houston metropolitan area was ranked first in the country in 2015. Exports from Seattle have grown rapidly in recent years, making it the nation’s third largest export city.
In addition, the database helps you monitor your area’s export achievements and can allow you to compare the performance of cities within the state. For example, while Ohio exports decreased by 2.9 percent from 2014 to 2015 according to United States Census Bureau, the value of Cincinnati’s exported goods was $24 billion, an increase of 15 percent over two years. That made it the 13th largest metropolitan area for exports in 2016.
Reporter’s Takeaway
• These links on Export.gov can help you find export trends in national data. You can use this data to add context to any export story you pursue in your local area.
• Export.gov’s links to state data can help you trace a state’s exports to other countries. You can use the data to analyze important figures like the employment rate and give insight into regional economies.
• The website’s links to metropolitan data can help you compare the export performance in local areas within a state.


